Graphical Results Presentation Pane
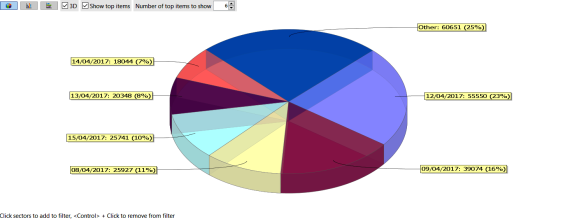
To the right of the Tabular Results Presentation Pane, there is the Graphical Results Presentation Pane displaying the same analysis results but in a graphical format for ease of apprehending.
As in the Tabular Results Presentation Pane, for further investigation of the data, each of the graphic sections may be selected to create a new filter definition, by holding down the keyboard's Ctrl button and clicking with the mouse on the graph slice to be added to the filter definition.
The new filter definition will also be updated in the Filter Definition Pane and Selection Tabs.
|
|
Note: |
Visualizer, upon initiation, comes up with some default filter definitions, thus presents, immediately, some data in the Graphical Results Presentation Pane, the Tabular Results Presentation Pane and the Filter Definition Pane and Selection Tabs. Please refer to section Initial Filter for further details on the default values. |